- To: Brian Blaylock <blaylockbk@xxxxxxxxx>
- Subject: Re: [python-users] MetPy NEXRAD Level 2 - Can get lat, lon out to use for plotting map?
- From: Ryan Connelly <rconne01@xxxxxxxxx>
- Date: Tue, 25 Apr 2017 18:39:07 -0400
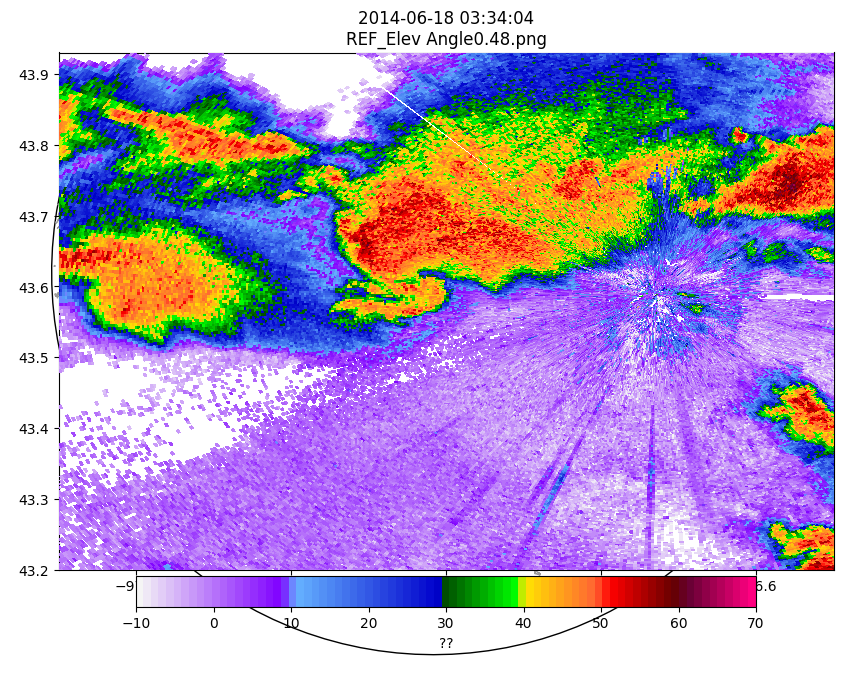
Hi Kevin and Brian,

I used Brian's script, which successfully georeferences the radar data.
But I'm still not getting my Cartopy features to show up.  I would just use
Basemap, except that that throws an error:

AttributeError: 'GeoAxesSubplot' object has no attribute 'drawcoastlines'.


I've attached my modified version of the code, as well as an example plot.

Thanks,
Ryan

On Tue, Apr 25, 2017 at 11:06 AM, Brian Blaylock <blaylockbk@xxxxxxxxx>
wrote:

> Hi Ryan,
>
> I was just about to reply, when I saw Kevin's email. I did what he
> suggested (using pyproj to convert the range and azimuth to a latitude
> longitude). I documented my method here: http://kbkb-wx-python.
> blogspot.com/2016/07/plotting-radar-data-with-metpy-pyproj.html
>
>
>  *Brian*
>
> On Mon, Apr 24, 2017 at 4:36 PM, Ryan Connelly <rconne01@xxxxxxxxx> wrote:
>
>> Hi,
>>
>> Using this code:
>> https://unidata.github.io/MetPy/examples/formats/NEXRAD_Leve
>> l_2_File.html#sphx-glr-examples-formats-nexrad-level-2-file-py
>>
>> Ideally, I should be able to just extract a lat and a lon variable from
>> the file, except that I don't know if they exist, and if they do, what
>> their names are.
>>
>> From there, I'd like to plot the georeferenced data over a base map using
>> CartoPy.  Is this possible?  (I just happen to already have some shapefiles
>> on hand that I want to use that I know CartoPy can read in.)
>>
>> Thanks,
>> Ryan
>>
>> --
>> Ryan Connelly
>> M.S. Student in Atmospheric Sciences, Stony Brook University
>> B.S. in Meteorology with Minors in Mathematics and GIS, Valparaiso
>> University
>> rconne01@xxxxxxxxx
>> ryan.connelly@xxxxxxxxxxxxxx
>>
>> _______________________________________________
>> NOTE: All exchanges posted to Unidata maintained email lists are
>> recorded in the Unidata inquiry tracking system and made publicly
>> available through the web.  Users who post to any of the lists we
>> maintain are reminded to remove any personal information that they
>> do not want to be made public.
>>
>>
>> python-users mailing list
>> python-users@xxxxxxxxxxxxxxxxxxxxxxxx
>> For list information, to unsubscribe, or change your membership options,
>> visit: http://www.unidata.ucar.edu/mailing_lists/
>>
>
>


--
Ryan Connelly
M.S. Student in Atmospheric Sciences, Stony Brook University
B.S. in Meteorology with Minors in Mathematics and GIS, Valparaiso
University
rconne01@xxxxxxxxx
ryan.connelly@xxxxxxxxxxxxxx
Attachment:
2014-06-18 03:34:04_REF_ElvAngle_0.48.png
Description: PNG image
import matplotlib as mpl
mpl.use('Agg')
import matplotlib.pyplot as plt
import numpy as np
from numpy import ma
import cartopy.feature as cfeature
import cartopy.crs as ccrs
from cartopy.io.shapereader import Reader
import pyproj
import sys
from pyproj import Geod
from metpy.cbook import get_test_data
from metpy.io import Level2File
from metpy.plots import ctables
import os
import datetime
from matplotlib.patches import Polygon
from matplotlib.collections import PatchCollection
from mpl_toolkits.basemap import Basemap

def getProjection():
    proj = ccrs.LambertConformal(central_latitude=43.6,
        central_longitude=-97.,
        standard_parallels=[43.5,43.7])
    return proj

def get_refl_cmap():
    'Custom colormap'
    color_map = [[245,245,245], #  0.0
                 [127, 0, 255], # 18.0-20.0
                 [102,178,255], # 20.0-22.0
                 [  0, 0, 204], # 28.0
                 [  0, 77,  0], # 30.0-32.0
                 [  0,255,  0], # 38.0
                 [255,230,  0], # 40.0
                 [255,100, 51], # 48.0
                 [255,  0,  0], # 50.0
                 [102,  0,  0], # 58.0
                 [102,  0, 51], # 60.0
                 [255,  0,128]] # 68.0-70.0
    n_bins = [-10.000, 8.000, 10.000, 28.000, 29.000, 38.000, 39.000, 48.000,
50.000, 58.000,
               60.000, 68.000]

    n_bins = [(l-n_bins[0]) for l in n_bins]
    n_bins = [(l/n_bins[-1]) for l in n_bins]
    color_map = [tuple([float(j)/255. for j in l]) for l in color_map]
    color_map = list(zip(n_bins,color_map))
    cmap =
mpl.colors.LinearSegmentedColormap.from_list('ryan_dbz',color_map,N=81)
    return cmap

def get_vel_cmap():
    'Custom colormap'
    color_map = [[  0,  0,255], # -100 kts
                 [  0,255,255], # -75 kts
                 [  0,255,  0], # -50 kts
                 [  0,100,  0], # -25 kts
                 [ 80,100, 80], # -5 kts
                 [255,255,255], # 0 kts
                 [ 80, 60, 60], # 5 kts
                 [ 80,  0,  0], # 25 kts
                 [255,  0,  0], # 50 kts
                 [255,100,  0], # 75 kts
                 [255,255,  0]] # 100 kts
    n_bins = [-100.000, -75.000, -50.000, -25.000, -5.000, 0.000, 5.000,
25.000, 50.000, 75.000,
               100.000]

    n_bins = [(l-n_bins[0]) for l in n_bins]
    n_bins = [(l/n_bins[-1]) for l in n_bins]
    color_map = [tuple([float(j)/255. for j in l]) for l in color_map]
    color_map = list(zip(n_bins,color_map))
    cmap =
mpl.colors.LinearSegmentedColormap.from_list('ryan_dbz',color_map,N=201)
    return cmap

def main(argv):

    #### Some Settings
    radar = 'KFSD'
    date = datetime.datetime(2014,6,18,3,34,4)

    #file name example: KCBX20160805_205859_V06
    #filename = '%s%04d%02d%02d_%02d%02d%02d_V06' % (radar,
date.year,date.month,date.day,date.hour,date.minute,date.second)

    f = Level2File('KFSD20140618_033404_V06.gz')

    rLAT = f.sweeps[0][0][1].lat
    rLON = f.sweeps[0][0][1].lon
    rDT = f.dt # this is in local time


    ## Create Figure and plot the background image outside the loop.
    ## Then, in each loop, we'll remove the radar data after we plotted and
saved.

    ### ---------------- Create Basemap -------------------------
#    fig = plt.figure(1,figsize=[8,8])
#    ax  = fig.add_subplot(111)
    top_right_lat = rLAT+1.25
    top_right_lon = rLON+1.25
    bot_left_lat = rLAT-1
    bot_left_lon = rLON-1

    fig = plt.figure(figsize=(10,8))
    ax = fig.add_subplot(2,1,1,projection=getProjection(),anchor='S')
    ax.set_position([0.08,0.09,0.84,0.85],which='both')
    ax.outline_patch.set_linewidth(1.0)
    ax.outline_patch.set_zorder(1)

    ## Map in cylindrical projection
    #m = Basemap(resolution='i',projection='cyl',\
    #  llcrnrlon=bot_left_lon,llcrnrlat=bot_left_lat,\
    #  urcrnrlon=top_right_lon,urcrnrlat=top_right_lat,)
    #maps = [
    #  'ESRI_Imagery_World_2D',    # 0
    #  'ESRI_StreetMap_World_2D',  # 1
    #  'NatGeo_World_Map',         # 2
    #  'NGS_Topo_US_2D',           # 3
    #  'Ocean_Basemap',            # 4
    #  'USA_Topo_Maps',            # 5
    #  'World_Imagery',            # 6
    #  'World_Physical_Map',       # 7
    #  'World_Shaded_Relief',      # 8
    #  'World_Street_Map',         # 9
    #  'World_Terrain_Base',       # 10
    #  'World_Topo_Map'            # 11
    #  ]

    lakes1 = cfeature.NaturalEarthFeature(category='physical',
        name='lakes',scale='10m',facecolor='#ffffff',edgecolor='#999999')
    lakes2 = cfeature.NaturalEarthFeature(category='physical',
        name='lakes',scale='10m',facecolor='none',edgecolor='#999999')

    # U.S. Counties require a custom shapefile
    counties = 'cb_2016_us_county_5m.shp'
    # Census Bureau counties don't line up with cartopy states, so just use
Census states too
    # It actually runs significantly faster this way anyway
    states = 'cb_2016_us_state_5m.shp'

    # Plot features on map using zorder
    # Leave zorder=3 for plotted vars
    ax.add_geometries(Reader(counties).geometries(),
                  ccrs.PlateCarree(),
                  facecolor='#f5f5f5', edgecolor='#999999',
linewidth=0.25,zorder=1)
    ax.add_geometries(Reader(counties).geometries(),
                  ccrs.PlateCarree(),
                  facecolor='none', edgecolor='#999999',
linewidth=0.25,zorder=4)

ax.add_geometries(Reader(states).geometries(),ccrs.PlateCarree(),facecolor='#f5f5f5',edgecolor='#999999',linewidth=0.6,zorder=1)

ax.add_geometries(Reader(states).geometries(),ccrs.PlateCarree(),facecolor='none',edgecolor='#999999',linewidth=0.6,zorder=4)
    ax.add_feature(lakes1,edgecolor='#999999',linewidth=0.6,zorder=1)
    ax.add_feature(lakes2,edgecolor='#999999',linewidth=0.6,zorder=4)

    ## Instead of using blank background, get a high resolution image from ESRI
#    m.arcgisimage(service=maps[2], xpixels = 1000, verbose= True)
#    ax.drawcoastlines(zorder=1000)
#    ax.drawstates(zorder=1000)
#    ax.drawcounties(linewidth=.5,zorder=1000)

    ### ----------- Loop through each sweep (scan elevation)
---------------------
    # Pull data out of the file
    # sweep reprsents the scan elevation angle (Note: sweep number is not in
order of lowest to highest scan)
    # to get the elevation angle try: f.sweeps[x][0][0].el_angle where x is
your sweep index

    #s = range(0,21) # a list of sweeps
    s = [1]
    for sweep in s:
        elv_angle = f.sweeps[sweep][0][0].el_angle


        # First item in ray is header, which has azimuth angle
        az = np.array([ray[0].az_angle for ray in f.sweeps[sweep]])


        # 5th item is a dict mapping a var name (byte string) to a tuple
        # of (header, data array)
        ref_hdr = f.sweeps[sweep][0][4][b'REF'][0]
        ref_range = np.arange(ref_hdr.num_gates) * ref_hdr.gate_width +
ref_hdr.first_gate
        ref = np.array([ray[4][b'REF'][1] for ray in f.sweeps[sweep]])
        try:
            vel_hdr = f.sweeps[sweep][0][4][b'VEL'][0]
            vel_range = (np.arange(vel_hdr.num_gates + 1) - 0.5) *
vel_hdr.gate_width + vel_hdr.first_gate
            vel = np.array([ray[4][b'VEL'][1] for ray in f.sweeps[sweep]])
            vel = vel * 1.94384   # Convert from m/s to kts
        except:
            pass
        try:
            sw_hdr = f.sweeps[sweep][0][4][b'SW'][0]
            sw_range = (np.arange(sw_hdr.num_gates + 1) - 0.5) *
sw_hdr.gate_width + sw_hdr.first_gate
            sw = np.array([ray[4][b'SW'][1] for ray in f.sweeps[sweep]])
        except:
            pass
        try:
            rho_hdr = f.sweeps[sweep][0][4][b'RHO'][0]
            rho_range = (np.arange(rho_hdr.num_gates + 1) - 0.5) *
rho_hdr.gate_width + rho_hdr.first_gate
            rho = np.array([ray[4][b'RHO'][1] for ray in f.sweeps[sweep]])
        except:
            pass
        try:
            phi_hdr = f.sweeps[sweep][0][4][b'PHI'][0]
            phi_range = (np.arange(phi_hdr.num_gates + 1) - 0.5) *
phi_hdr.gate_width + phi_hdr.first_gate
            phi = np.array([ray[4][b'PHI'][1] for ray in f.sweeps[sweep]])
        except:
            pass
        try:
            zdr_hdr = f.sweeps[sweep][0][4][b'ZDR'][0]
            zdr_range = (np.arange(zdr_hdr.num_gates + 1) - 0.5) *
zdr_hdr.gate_width + zdr_hdr.first_gate
            zdr = np.array([ray[4][b'ZDR'][1] for ray in f.sweeps[sweep]])

        except:
            pass
        #fig, axes = plt.subplots(1, 2, figsize=(15, 8))

        if len(f.sweeps[sweep][0][4])==4:
            get_these = (ref,rho,phi,zdr)
            get_these_r = (ref_range,rho_range,phi_range,zdr_range)
            fignum = [1,2,3,4]
            names = ('REF','RHO','PHI','ZDR')
        elif len(f.sweeps[sweep][0][4])==3:
            get_these = (ref,sw,vel)
            get_these_r = (ref_range,sw_range,vel_range,)
            fignum = [1,2,3]
            names = ('REF','SW','VEL')
        else:
            get_these = (ref,rho,phi,zdr,sw,vel)
            get_these_r =
(ref_range,rho_range,phi_range,zdr_range,sw_range,vel_range)
            fignum = [1,2,3,4,5,6]
            names = ('REF','RHO','PHI','ZDR','SW','VEL')


    #for var_data, var_range, ax in zip((ref, rho), (ref_range, rho_range),
axes):

        for var_data, var_range, num, name in zip(get_these, get_these_r,
fignum, names):

            #print name

            ax = fig.add_subplot(111)  # drawing axes
            # Turn into an array, then mask
            data = ma.array(var_data)
            data[np.isnan(data)] = ma.masked

            #rngs = np.array([ray[0].rad_length for ray in f.sweeps[sweep]])
            rng = np.linspace(0, var_range[-1], data.shape[-1] + 1)
            #print len(rng)

            # Convert az, range to a lat/lon
            g = Geod(ellps='clrk66') # This is the type of ellipse the earth is
projected on.
                                 # There are other types of ellipses you can
use,
                                 # but the differences will be small
            center_lat = np.ones([len(az),len(rng)])*rLAT
            center_lon = np.ones([len(az),len(rng)])*rLON
            az2D = np.ones_like(center_lat)*az[:,None]
            rng2D = np.ones_like(center_lat)*np.transpose(rng[:,None])*1000
            lon,lat,back=g.fwd(center_lon,center_lat,az2D,rng2D)


            # Convert az,range to x,y
            xlocs = var_range * np.sin(np.deg2rad(az[:, np.newaxis]))
            ylocs = var_range * np.cos(np.deg2rad(az[:, np.newaxis]))

            # Plot the data
            cmap = ctables.registry.get_colortable('viridis')

            #p = ax.pcolormesh(xlocs, ylocs, data, cmap=cmap)
            if name=='VEL':
                p =
ax.pcolormesh(lon,lat,data,cmap=get_vel_cmap(),vmax=100.,vmin=-100.,zorder=3)
            elif name=='REF':
                p =
ax.pcolormesh(lon,lat,data,cmap=get_refl_cmap(),vmin=-10.,vmax=70.,zorder=3)
            else:
                p =
ax.pcolormesh(lon,lat,data,cmap=cmap,vmin=-10.,vmax=70.,zorder=3)
            #m.set_aspect('equal', 'datalim')
            #ax.set_xlim(-40, 20)
            #ax.set_ylim(-30, 30)

            cb = plt.colorbar(p,orientation='horizontal',shrink=.8,pad=.01,
                       label='??')

            plt.title('%s\n%s at Elev Angle %.2f'%(date,name,elv_angle))
            plt.xlim([-97.5,-96.5])
            plt.ylim([43.2,43.93])

plt.savefig('/D2/ryan/python/%s_%s_ElvAngle_%.2f.png'%(date,name,elv_angle),bbox_inches='tight')
            print('saved',name)
            cb.remove()         # need to remove the colorbar before removing
the pcolormesh
            p.remove()

if __name__ == '__main__':
    main(sys.argv[1:])
- Follow-Ups:
- References: